sinh()
import math
print(math.sinh(-1))       # -1.1752011936438014
print(math.sinh(-1.5))     # -2.1292794550948173
print(math.sinh(-5))       # -74.20321057778875
print(math.sinh(0))        # 0.0
print(math.sinh(1))        # 1.1752011936438014
print(math.sinh(1.5))      # 2.1292794550948173
print(math.sinh(5)) # 74.20321057778875Inputs in degree
We can convert radian value to degree and use the sameimport math
in_degree = 60
in_redian = math.radians(in_degree)
print(math.sinh(in_redian)) # 1.2493670505239751 1 radian = 57.2957914331 degree
1 degree = 0.0174533 radian
1 degree = 0.0174533 radian
Drawing graph of sinh()
We will use Matplotlib to generate graph of sinh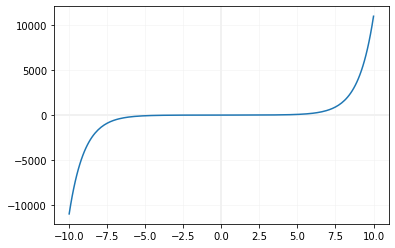
import matplotlib.pyplot as plt
x=[]
y=[]
i=-10
while (i<=10):
    x.append(i)
    y.append(math.sinh(i))
    i=i+0.1
plt.axvline(x=0.00,linewidth=2, color='#f1f1f1')
plt.axhline(y=0.00,linewidth=2, color='#f1f1f1')
plt.plot(x,y)
plt.grid(linestyle='-',
    linewidth=0.5,color='#f1f1f1')
plt.show()Subscribe to our YouTube Channel here
This article is written by plus2net.com team.
https://www.plus2net.com

 Python Video Tutorials