tan()
import math
print(math.tan(1))       # 1.5574077246549023
print(math.tan(0.56))    # 0.6269495350526982
print(math.tan(-0.56))   # -0.6269495350526982
print(math.tan(-1))      # -1.5574077246549023
print(math.tan(0))       # 0.0
print(math.tan(math.pi)) # -1.2246467991473532e-16Inputs in degree
We can convert radian value to degree and use the sameimport math
in_degree = 90
in_redian = math.radians(in_degree)
print(math.tan(in_redian)) # 1.633123935319537e+16 1 radian = 57.2957914331 degree
1 degree = 0.0174533 radian
1 degree = 0.0174533 radian
Drawing graph of tan()
Utang this we will use Matplotlib to generate graph of tan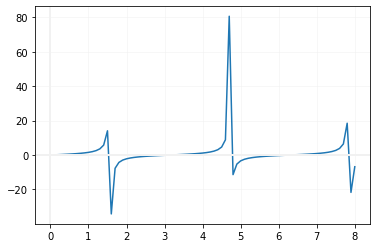
import matplotlib.pyplot as plt
x=[]
y=[]
i=0
while (i<=8):
    x.append(i)
    y.append(math.tan(i))
    i=i+0.1
plt.plot(x,y)
plt.axvline(x=0.00,linewidth=2, color='#f1f1f1')
plt.axhline(y=0.00,linewidth=2, color='#f1f1f1')
plt.grid(linestyle='-', linewidth=0.5,color='#f1f1f1')
plt.show()Subscribe to our YouTube Channel here
This article is written by plus2net.com team.
https://www.plus2net.com

 Python Video Tutorials